OW64-Chart

The Power of the OW64-Chart: Mastering Strategic Focus in Business and Life.
Ever found yourself drowning in a sea of to-dos with no clear direction? You’re not alone. Many entrepreneurs and leaders face the same challenge—plenty of activity but uncertain progress toward what truly matters.
This is where the OW64-Chart (OW = Open Window), a powerful component of the Harada Method, can transform your approach to strategic planning and execution. In my book Embark, I touched on this tool, but here I want to dive deeper into its origins, show you completed examples, and reveal how this methodology helps transform individuals from underperformers to champions.
The Birth of the Harada Method: A Teacher’s Discovery.
 Source: theharadamethod.com
The story begins not in a corporate boardroom but in a Japanese middle school track field in the 1980s. Takashi Harada was a dedicated physical education teacher faced with a seemingly impossible challenge: how to transform his underperforming students into competitive athletes.
His school, located in one of the poorest districts in Osaka, rarely produced notable athletic achievements. But Harada refused to accept this as destiny. Through careful observation and systematic experimentation, he developed a methodology that would eventually bear his name.
Within a remarkably short time, Harada’s students began winning competitions—not just locally, but nationally. His school produced multiple gold medalists and broke numerous records, all from a starting point of mediocrity.
The secret? Harada discovered that success wasn’t just about physical training. It required a holistic system that addressed goal-setting, self-analysis, plan development, and routine creation. At the heart of his system was a structured approach to visualizing and breaking down goals—what we now know as the OW64-Chart.
Why OW64? The Magic of Structure.
Think of the OW64-Chart as a flywheel for your vision. Remember in Embark when I mentioned how a flywheel gains momentum with every push? The OW64-Chart works the same way—every completed initiative adds momentum toward your central goal.
The number 64 comes from a simple but powerful structure: one central long-term goal, surrounded by 8 key focus areas, each containing 8 specific initiatives or milestones. This 8×8 format creates a comprehensive roadmap that’s both detailed enough to guide action and simple enough to maintain clarity.
Our brains struggle with overwhelming complexity but thrive with organized information. The OW64-Chart strikes the perfect balance—comprehensive without being chaotic. It forces prioritization while ensuring thoroughness in each area.
The OW64-Chart in Action: Shohei Ohtani’s Path to MLB Dominance.
What makes the OW64-Chart so remarkable is seeing it in action with real-world results. I’ve recently discovered something extraordinary—an actual OW64-Chart created by Shohei Ohtani when he was just 15 years old. This isn’t hypothetical; it’s the real roadmap that helped transform a talented teenager into one of baseball’s most revolutionary players.
Looking at Ohtani’s actual chart from his sophomore year in high school (2010), you can see the structured approach that would eventually lead him to MLB superstardom. His chart reveals a remarkable level of focus and self-awareness unusual for someone so young.
Shohei Ohtani, 12/6/2010 – Sophomore in High School
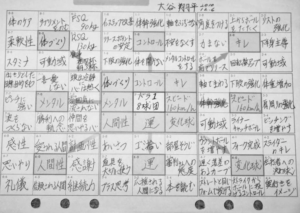

Source: theharadamethod.com
The chart is organized meticulously with clear focus areas, including:
- Core body development
- Flexibility
- Range of motion
- Physical training
- Mental discipline
- Throwing mechanics
- Hitting techniques
- Pitching precision
What’s fascinating is how specific his initiatives are. For pitching, he included targets like “Speed 160km/hr, 99 mph” and “Catch liner balls.” For batting, he specified “Hit the ball from above” and “Create an angle.” This level of detail shows he wasn’t just dreaming of baseball success—he was engineering it systematically.
Even more revealing is how Ohtani balanced physical development with mental training. His chart includes items like “Don’t create ups and downs emotionally” and “The heart to care team matters.” This holistic approach—addressing physical, technical, and mental aspects in equal measure—foreshadowed the complete player he would become.
A Business Leader’s OW64-Chart Example.
Now, let’s translate this to business leadership. Here’s how a technology company CEO might structure a OW64-Chart:
Central Goal: “Grow company to $50M annual revenue with 20% profit margin in three years”
Eight Key Focus Areas:
- Sales Expansion
- Product Innovation
- Team Development
- Operational Excellence
- Customer Experience
- Strategic Partnerships
- Brand Positioning
- Financial Optimization
Under “Team Development,” the eight initiatives might include:
- Implement leadership development program for all managers
- Create structured onboarding system for new hires
- Establish quarterly performance coaching framework
- Develop specialized training tracks for technical roles
- Build mentorship program pairing junior and senior staff
- Create internal certification system for key competencies
- Implement team wellness initiative
- Establish clear career progression paths for all departments
This structured approach ensures the CEO isn’t just focusing on revenue growth through sales and marketing—they’re building a comprehensive system where all aspects of the business advance in concert toward the central goal.
Bridging Long-Term Vision with Daily Action: The 100-Day OW64-Chart.
While the standard OW64-Chart excels at mapping out a long-term strategy, I’ve discovered an incredibly powerful variation that bridges the gap between your three-year vision and today’s to-do list: the 100-Day OW64-Chart.
In my own companies, I maintain both long-term OW64-Charts for each business and focused 100-day versions that create immediate momentum. This approach creates a powerful sense of urgency while ensuring daily activities directly contribute to long-term objectives.
The 100-Day OW64-Chart follows the same structure but zooms in on a single quarter. The central goal becomes something achievable in three months, while the surrounding initiatives become much more granular and immediately actionable.
This approach works brilliantly at multiple levels:
- For executives managing company-wide initiatives
- For department heads responsible for one of the eight key areas from the main chart
- For individuals accountable for specific milestones within a larger plan
The beauty of this approach is how it translates abstract long-term visions into concrete daily actions. When team members can see how today’s task directly connects to this quarter’s goal, which supports the three-year vision, engagement and focus naturally increase.
I’ve found that 100 days strikes the perfect balance—long enough to accomplish something substantial, but short enough to create momentum and urgency. Each day matters when you have a clear 100-day objective in front of you.
For example, if your three-year OW64-Chart has “Implement company-wide leadership development program” as one initiative, your 100-Day chart might focus entirely on the first phase: “Complete leadership competency framework and assessment tools,” with daily and weekly tasks mapped out in detail.
This nested approach to the OW64-Chart creates a seamless connection between strategic thinking and tactical execution—one of the most challenging aspects of effective leadership.
From Japan to the World: Norman Bodek’s Contribution.
The Harada Method might have remained a local Japanese phenomenon if not for Norman Bodek, often called the “Godfather of Lean.” During one of his trips to Japan studying business methodologies, Bodek discovered Harada’s work and was immediately struck by its potential.
Recognizing that Harada had developed something extraordinary, Bodek collaborated with him to bring the method to Western audiences. Together they co-authored “The Harada Method: The Spirit of Self-Reliance,” introducing these concepts to business leaders worldwide.
Today, elements of the Harada Method have been adopted by organizations ranging from manufacturing giants like Toyota to healthcare institutions, technology firms, and even professional sports teams.
Creating Your Own OW64-Chart: A Practical Guide

Source: theharadamethod.com
Now, let’s get practical, but have fun doing it! I find this photo inspiring and it makes the process easier to visualize in your own organization. How do you create your own OW64-Chart?
First, visit Tools to download the template I mentioned in Embark.
Then, follow these steps:
- Write your long-term goal in the heart of the chart. Be specific and measurable—vague aspirations won’t drive clear action.
- Identify the eight most critical areas of focus that will contribute to achieving your central goal.
- For each focus area, develop eight specific initiatives, tasks, or milestones. Set deadlines and assign clear ownership.
- Review your entire chart to ensure everything aligns with your central goal.
- Implement a regular review cadence—perhaps weekly for individual initiatives and monthly for overall progress.
The power of the OW64-Chart isn’t just in its creation but in its ongoing use as a dynamic tool that guides decision-making and resource allocation.
Beyond Planning: The OW64-Chart as a Communication Tool.
One of the most underappreciated aspects of the OW64-Chart is its effectiveness as a communication tool. When everyone on your team can visualize the central goal and understand how their work connects to it through specific focus areas, alignment naturally follows.
Think about how often misalignment occurs in organizations. The marketing team pursues one direction while product development heads another way. The sales team makes promises the operations team struggles to fulfill.
The OW64-Chart solves this by creating a single, visible reference point for everyone. It’s like giving each team member their own GPS, calibrated to your organization’s destination.
Common Pitfalls to Avoid.
As with any powerful tool, there are ways to misuse the OW64-Chart:
- Too vague: Filling your chart with broad ambitions rather than specific, measurable initiatives
- No deadlines: Failing to attach timelines to your initiatives
- No ownership: Not clarifying who’s responsible for each initiative
- Set and forget: Creating the chart but not using it for ongoing decision-making
- Overcomplicating: Adding too much detail beyond the core structure
Remember, the strength of this method lies in its balance of comprehensiveness and simplicity.
The Path Forward: Your OW64-Chart Journey.
Like my dad’s advice on the golf green about aiming beyond the hole, the OW64-Chart helps you look beyond immediate concerns to the bigger picture. It’s not just about what needs to happen today—it’s about building momentum toward your ultimate goal.
Your journey with the OW64-Chart begins with a single step: defining your central goal. What’s the ultimate destination for your business or career? Once that’s clear, the rest of the process will flow naturally.
Remember, as I shared in Embark, the goal of your systems and tools is not organization for its own sake. It’s about creating stability, fostering improvement, and building a business that thrives with or without your constant presence.
The OW64-Chart isn’t just another tool—it’s a way of thinking that can transform how you approach every aspect of your business and life.
Ready to start? Visit OW64-Chart to download your template today.
Sources/References:
The Harada Method
Reddit: 15-year-old Shohei